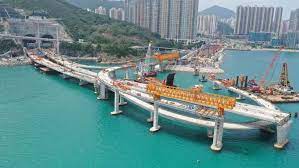
Aurecon Asia:Tseung Kwan O – Lam Tin Tunnel (TKO-LTT) – Before the blast
www.asiamanufacturingnewstoday.com currently sits in the top 70 manufacturing & technology media platforms for readership around the world.

From vertical to volumetric
As Hong Kong’s population grows, the scarcity of land poses challenges for transport and city planners alike. The utilisation of underground space plays an evermore important role in the sustainable development of Hong Kong.
Numerous transport tunnels now weave their way under the Hong Kong landscape and TKO-LTT – Main Tunnels and Associated Works will be the latest. Drill and blast excavation for TKO-LTT will navigate through the fourth most densely populated country in the world.
Aurecon’s use of a geographic information system (GIS) for the project’s Blasting Assessment Reports avoided the need to manually engineer vibration contours, and produced accurate 3D visualisations of blast plumes.
Interactive 3D presentations of the blast plumes from GIS showed visually the relationship between built structures and the ground vibrations.
In future, these 3D visualisations may also be helpful tools for communicating with stakeholders.
Blasting through the problem
The TKO-LTT – Main Tunnels and Associated Works is a dual two lane highway connecting Tseung Kwan O and East Kowloon. Together with the future Trunk Road T2 in Kai Tak Development and Central Kowloon Route, it will form the new strategic route network of Hong Kong.
The tunnel and a significant amount of surface works are to be excavated using drill and blast.

“As the manual process was being explained to us, we knew straight away that a spatial solution would bring better results.” Mike Pinkerton, Aurecon.
Aurecon prepared the Contractor’s Blasting Assessment Reports for TKO-LTT – Main Tunnels and Associated Works in Hong Kong. With a geology of mostly hard granite the approach of drill and blast excavation was the most effective.
There were two main environmental considerations for drill and blast excavation, both of which have mathematical formulas to model them against.
- Vibration – transmitted through the rock, measured as Peak Particle Velocity
- Air overpressure – the shockwave of audible and inaudible ‘noise’ generated at a blast
Limits on these values were derived from and applied to the built environment — buildings, transport infrastructure and infrastructure services (called Sensitive Receivers).
In addition to these calculations, which were already being managed in Excel spreadsheets, CAD drafters were manually generating surface contour lines of vibration, as well as producing charts and tables in Excel. Production of these deliverables needed to be streamlined.
The digital journey
As a digitally connected global organisation, Aurecon’s team in Hong Kong approached the New Zealand GIS team to help them blast through the problem.
“After outlining the inputs, workflow and deliverables, it was immediately clear to the team that a geospatial approach would be plausible and bring benefits. The geographical information system (GIS) solution was deployed to take the complex data values and digitally produce vibration contours and 3D displays of the blast plumes,” said Mike Pinkerton, Technical Director – Geospatial, Aurecon.

The digital reality
Many of the world’s most useful tools are brought about by incremental improvements rather than a single new idea. This was the case with using GIS on TKO-LTT – Main Tunnels and Associated Works. A Python GIS software application was essentially the glue holding together a number of plug-ins inserted by Aurecon’s Auckland GIS team. This approach meant the GIS application could handle the volume of data, generate the workflow process and output the 3D visuals.
The sheer volume of calculations made the traditional Excel spreadsheets an inefficient and isolated platform to perform the calculations. The GIS application read Excel files of buildings and blast points and calculated the maximum blast weight for each point underground. Surface blasting required a similar workflow but stratified across vertical intervals.
“All the outputs were published to 3D web applications to visualise project interaction with the built environment,” said Josh Barry, Aurecon Associate in Hong Kong.
“The GIS application provided us with something that we didn’t previously have, visualisations that could clearly demonstrate the relationship between sensitive receivers and vibration.”
Aurecon GIS workflow

Evolution of the contour

3D contour from blasting along the Lam Tin Tunnel
The primary purpose of the GIS application was to effectively manage large quantities of information within a single database, while efficiently completing extensive calculations and outputting two dimensional (2D) contours for drafting. As the tool was in development, it was clear that there were other potential benefits of the application.
Stakeholder and community consultation, one of the principal causes of delays in obtaining a blasting licence, was an obvious benefit.
People first think of the danger of explosives when they hear about blast excavations. Images of workers in pairs, one with a hammer, the other a chisel, mechanically tapping holes and filling them with dynamite spring to mind. However, modern day drill and blast could not be further from this image.
Jumbos with computer controlled drills precisely drill engineered blast patterns for maximum pull length. The use of electronics allows blast holes to be detonated in precise order within milliseconds of each other to minimise resulting vibrations.
The majority of stakeholders and communities are not familiar with excavation by drill and blast, and are rightfully protective of their assets. There are thousands of protected historic buildings in Hong Kong.
The 3D visualisations from GIS are perfect for demonstrating the extent of the impact of each blast. Moving forward it is expected that this tool will be successful in educating stakeholders about the drill and blast process, and helpful in alleviating their concerns.


